Case Study - Good Board vs Bad Board
Reducing Time on Debugging Boards and Improving Design Yield
Summary:
Tests with the EMxpert EHX were done on two different designs at the production facility of a Contract Manufacturer in Norway (CM). Samples of each design were presented both with problems and without. The tests were done to determine if the problems could be identified when comparing the very-near magnetic field emissions of the good boards and the problem boards.
The problem with the first design was identified by comparing the very near-field spatial scans at 1.48 MHz. A lack of detected current correlated with what the CM suspected was a failed component.
The second design was presented with a problem that had been eluding detection. It showed a poor RSSI reading and had been isolated to the IF chain. A comparison of the IF currents between a good board and the problem board indicated an issue in a location different from where the CM had assumed the problem was. Further investigation uncovered a soldering issue with a single component.
With both designs, we were able to detect issues in the very near-field emissions which would have and did assist the CM engineers in tracking down root causes. The initial scans took a long time to complete since we were not familiar with the design or the expected results. With the proper initial work done on a given design, this tool could be very effective at quickly identifying issues in the complex designs that Kitron works on.
Set-Up:
For all tests, the CM test boards were placed on the EMxpert EHX. For the first design, only the bottom side of the board was measured because a heat sink was present over the entire board on the top side. Modifications to this heat sink would allow testing of both sides of the board.
For the second design, both the top and bottom sides were measured.
All testing was done with the Keysight Fieldfox N9912A. This instrument is part of EMSCAN’s standard demo kits and is much slower than a benchtop spectrum analyzer. Using a faster spectrum analyzer would be another way to improve the analysis time.
Board 1 Test Results:
This section includes the results from the first design. This design was an underwater acoustic sensor. The spectral emissions of the bad board did not indicate a problem by itself but it displayed the peak frequencies that needed to be analyzed closely. Knowledge of the design and the problem provided by the CM also helped narrow down the frequencies that needed to be looked at.
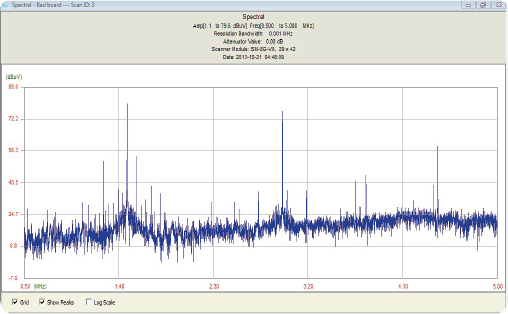
Figure 1 – Spectral emissions of a bad board for Design 1:
This spectral scan was a small sample of all emissions coming from the board. In this region, the spatial analysis did show variation in areas of the board that correlated with suspected problems. This is shown in the spatial images below.
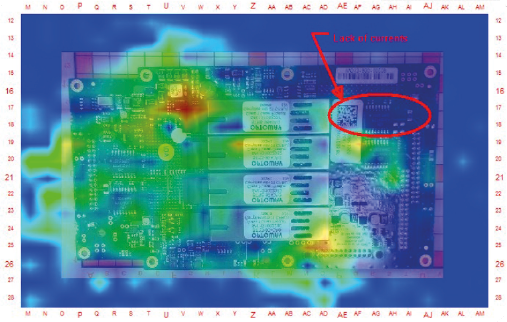
Figure 2 – Spatial emissions of a bad board at 1.48 MHz showing a quiet area of the board
The image above shows a noticeable lack of currents at the component that was suspected to be the cause of the problems. To confirm whether this is in fact an anomaly an equivalent scan of a good board was done. The good board does show a noticeable difference specifically in this area.
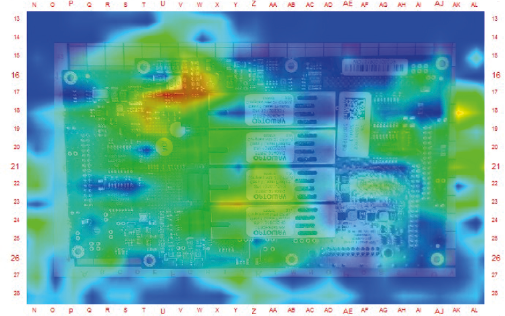
Figure 3 – Spatial results from a good board at 1.48MHz
A spatial scan focused on the area where the difference confirms that currents are detected along the expected traces.
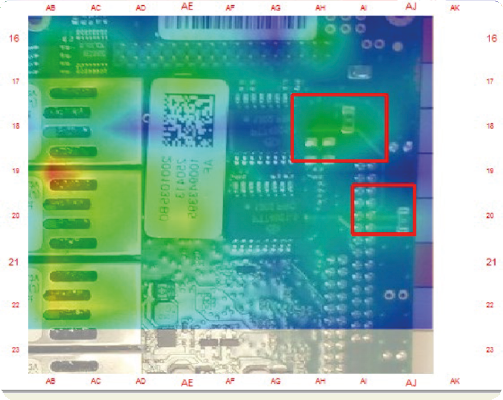
Figure 4 – Spatial results from a good board showing the critical location with currents present
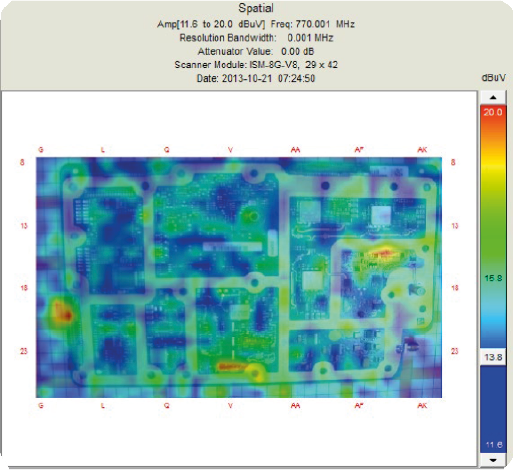
Figure 5 – Spatial scan of the good board at the IF frequency
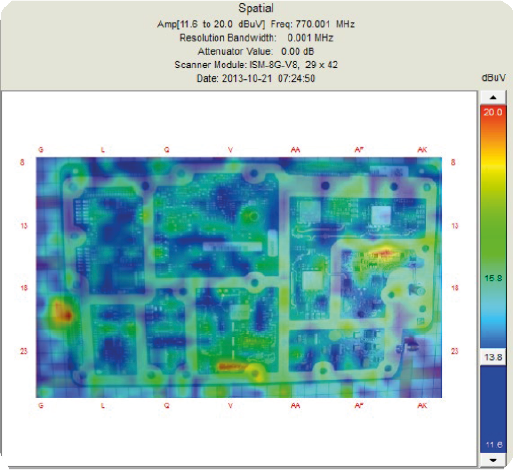
Figure 6 – Spatial scan of the bad board at the IF frequency
Once it was confirmed that there was a problem at the IF frequency a focused analysis on the IF chain was done. Zooming in on the area of the IF right as it exited the first mixer showed a very-near-field emission variation immediately following the SAW filters.
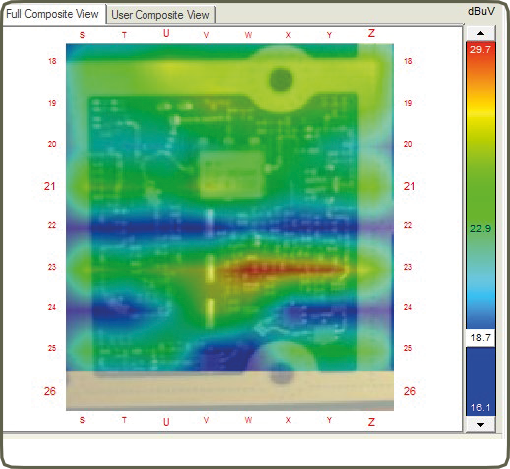
Figure 7 – Spatial scan of the IF chain of the good board showing strong emissions throughout
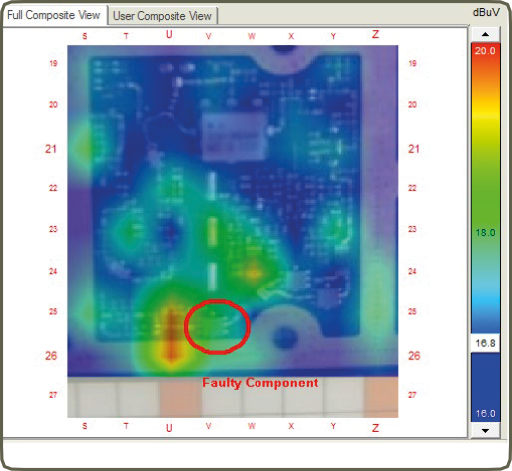
Figure 8 – Spatial scan of the bad board at the IF frequency
After viewing the large variation in the very-near-field emissions at this location, a visual inspection of the board revealed the SAW filter highlighted in the image above was populated with a 90° rotation meaning no signal would pass through.
Conclusions:
The EMScanner has shown itself to be an extremely useful tool for identifying differences between good and bad boards. In these examples, it took a couple of hours to get a baseline analysis of the good boards done. This would normally be the case for a new design. However, once these baselines are done it should be possible to quickly identify locations of the board which may be causing problems.
The EMScanner should reduce the amount of time spent debugging boards and should improve the yield of designs which are currently problematic to debug.
SCANNER USERS

Testimonials
The instrument provides spatial and spectral scans that allow design teams to cut one to two design cycles out of their product development process. It also reduces their EMI testing time by up to two orders of magnitude.
The design team conducted the scans on the EMxpert system in their offices. In a matter of minutes, they obtained the results. Testing the design in a third party chamber would have have been weeks away